
Using Operational Insights
Introduction: Maximize Program Efficiency
The Operational Insights section in your Partner Interface is designed to give you unmatched, granular visibility into the day-to-day health and running of your incentive programs.
By continuously monitoring these key operational metrics, your team can proactively identify potential bottlenecks, manage reward validation, track support requests, and implement necessary improvements to maximize your program's efficiency and user satisfaction.
Step-by-Step Guide: Accessing Operations Insights
- Navigate to the Analyze section from your main dashboard.
- Click the Operations tab in the Analyze navigation menu. Note: This section complements the existing Performance and Funnel insights to give you a complete view of your programs.
- Apply the global filters to narrow your focus:
- Programs: Select the specific programs you want to analyze.
- Date range: Choose the time frame for the data you want to view. The default range is 28 days to smooth out typical weekly fluctuations and improve comparability.
- Note: These filters are applied globally to all Insights dashboards within the Analyze section, allowing for quick cross-dashboard analysis.
Dashboard Details: What You Can Monitor
The Operations section consists of three detailed dashboards: Overview, Users, and Agents.
Operations Overview
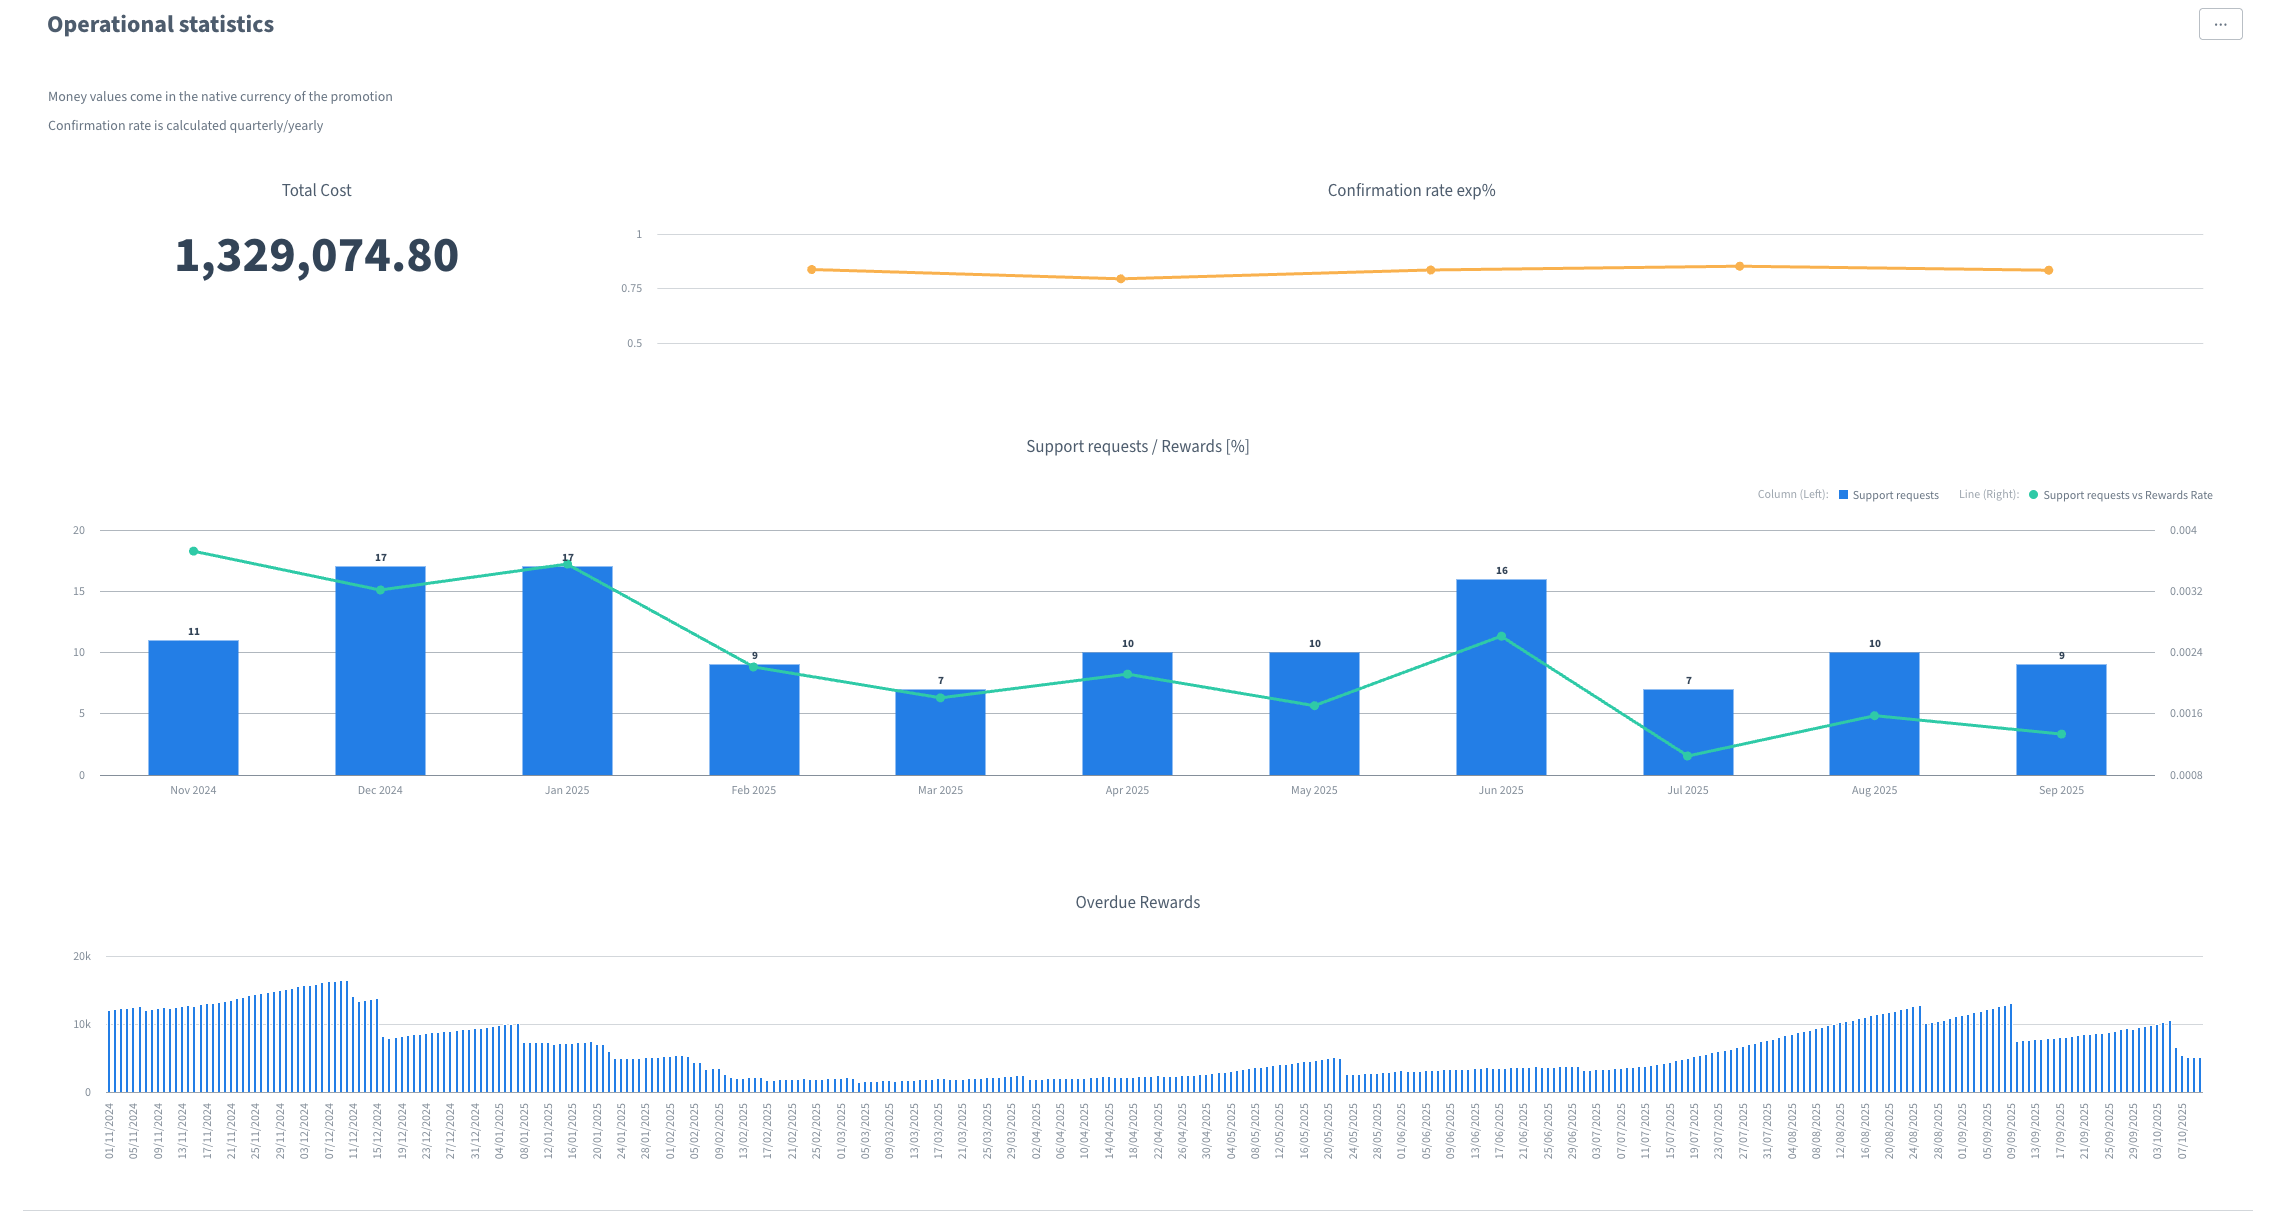
This dashboard provides a critical summary of your program's day-to-day operational health. Use these metrics to spot issues before they impact the user experience.
| Metric | Description | Value for Your Team |
| Program Costs | Total financial cost associated with the program over the selected period. | Monitor total expenditure and budget pacing. |
| Confirmation Rate | The percentage of rewards that have been approved versus rejected. | A key indicator of the health of conversions derived from the program and user satisfaction. |
| Support Requests / Rewards (%) | The percentage of rewards that resulted in a support request from the user. | Helps flag potential friction points in the user journey, tracking setup or reward fulfillment process that create operational overhead. |
| Overdue Rewards | The number of rewards that have not been confirmed within their promised validation timeframe. | Critical for ensuring timely payout and maintaining user trust. |
Users Dashboard
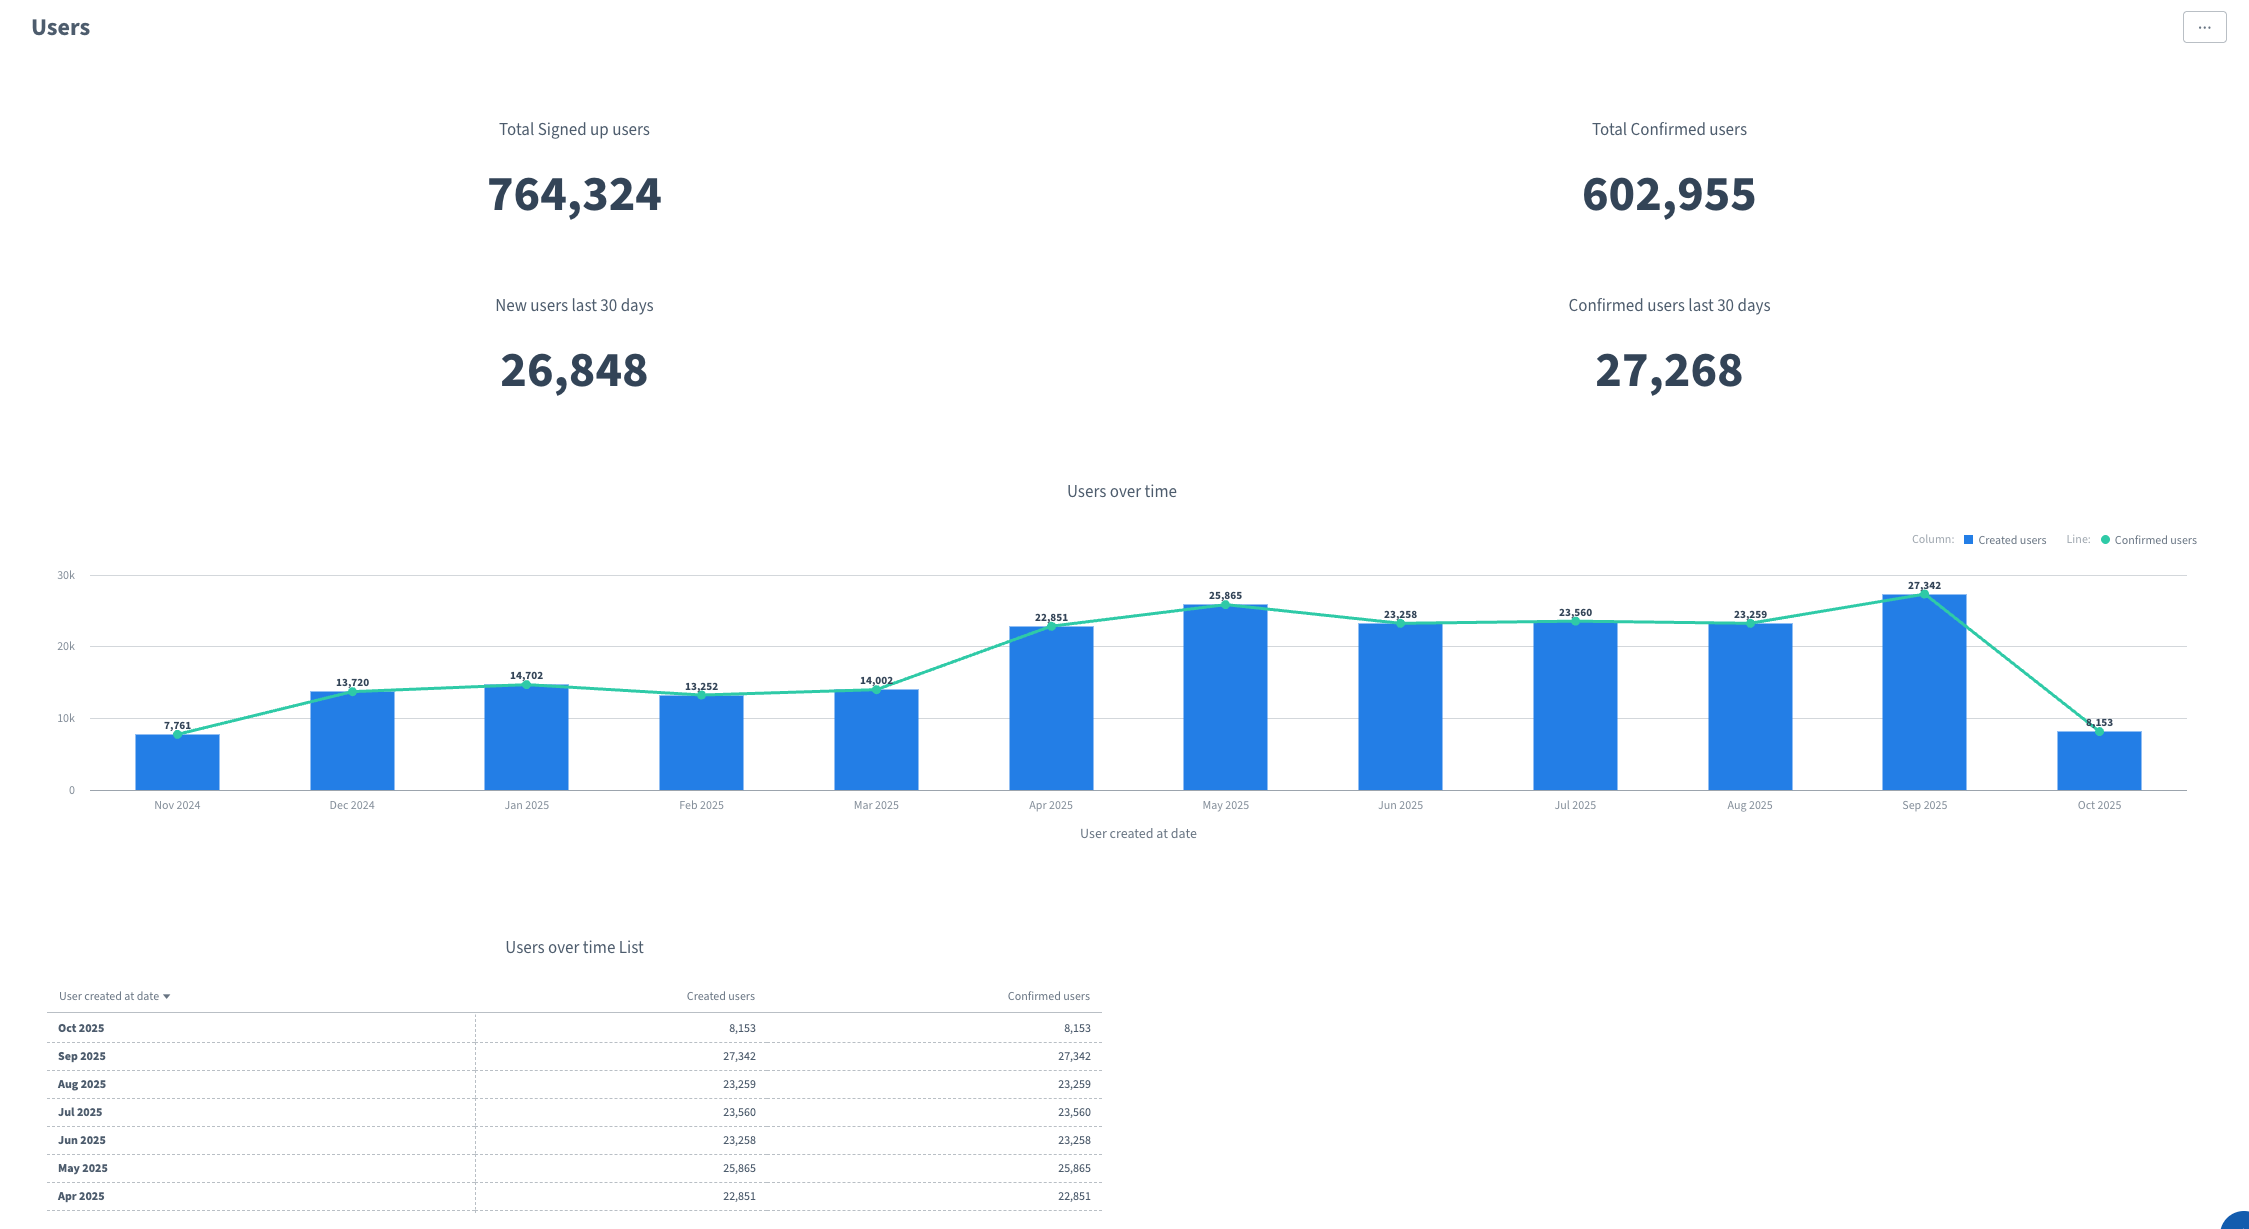
Focus on how your user base is growing and engaging with your programs.
- Total Signed-up Users and Confirmed Users: Monitor the overall size and quality of your user base.
- Users over time: A chart and list view showing the creation and confirmation trends of your users over the selected date range.
Agents Dashboard
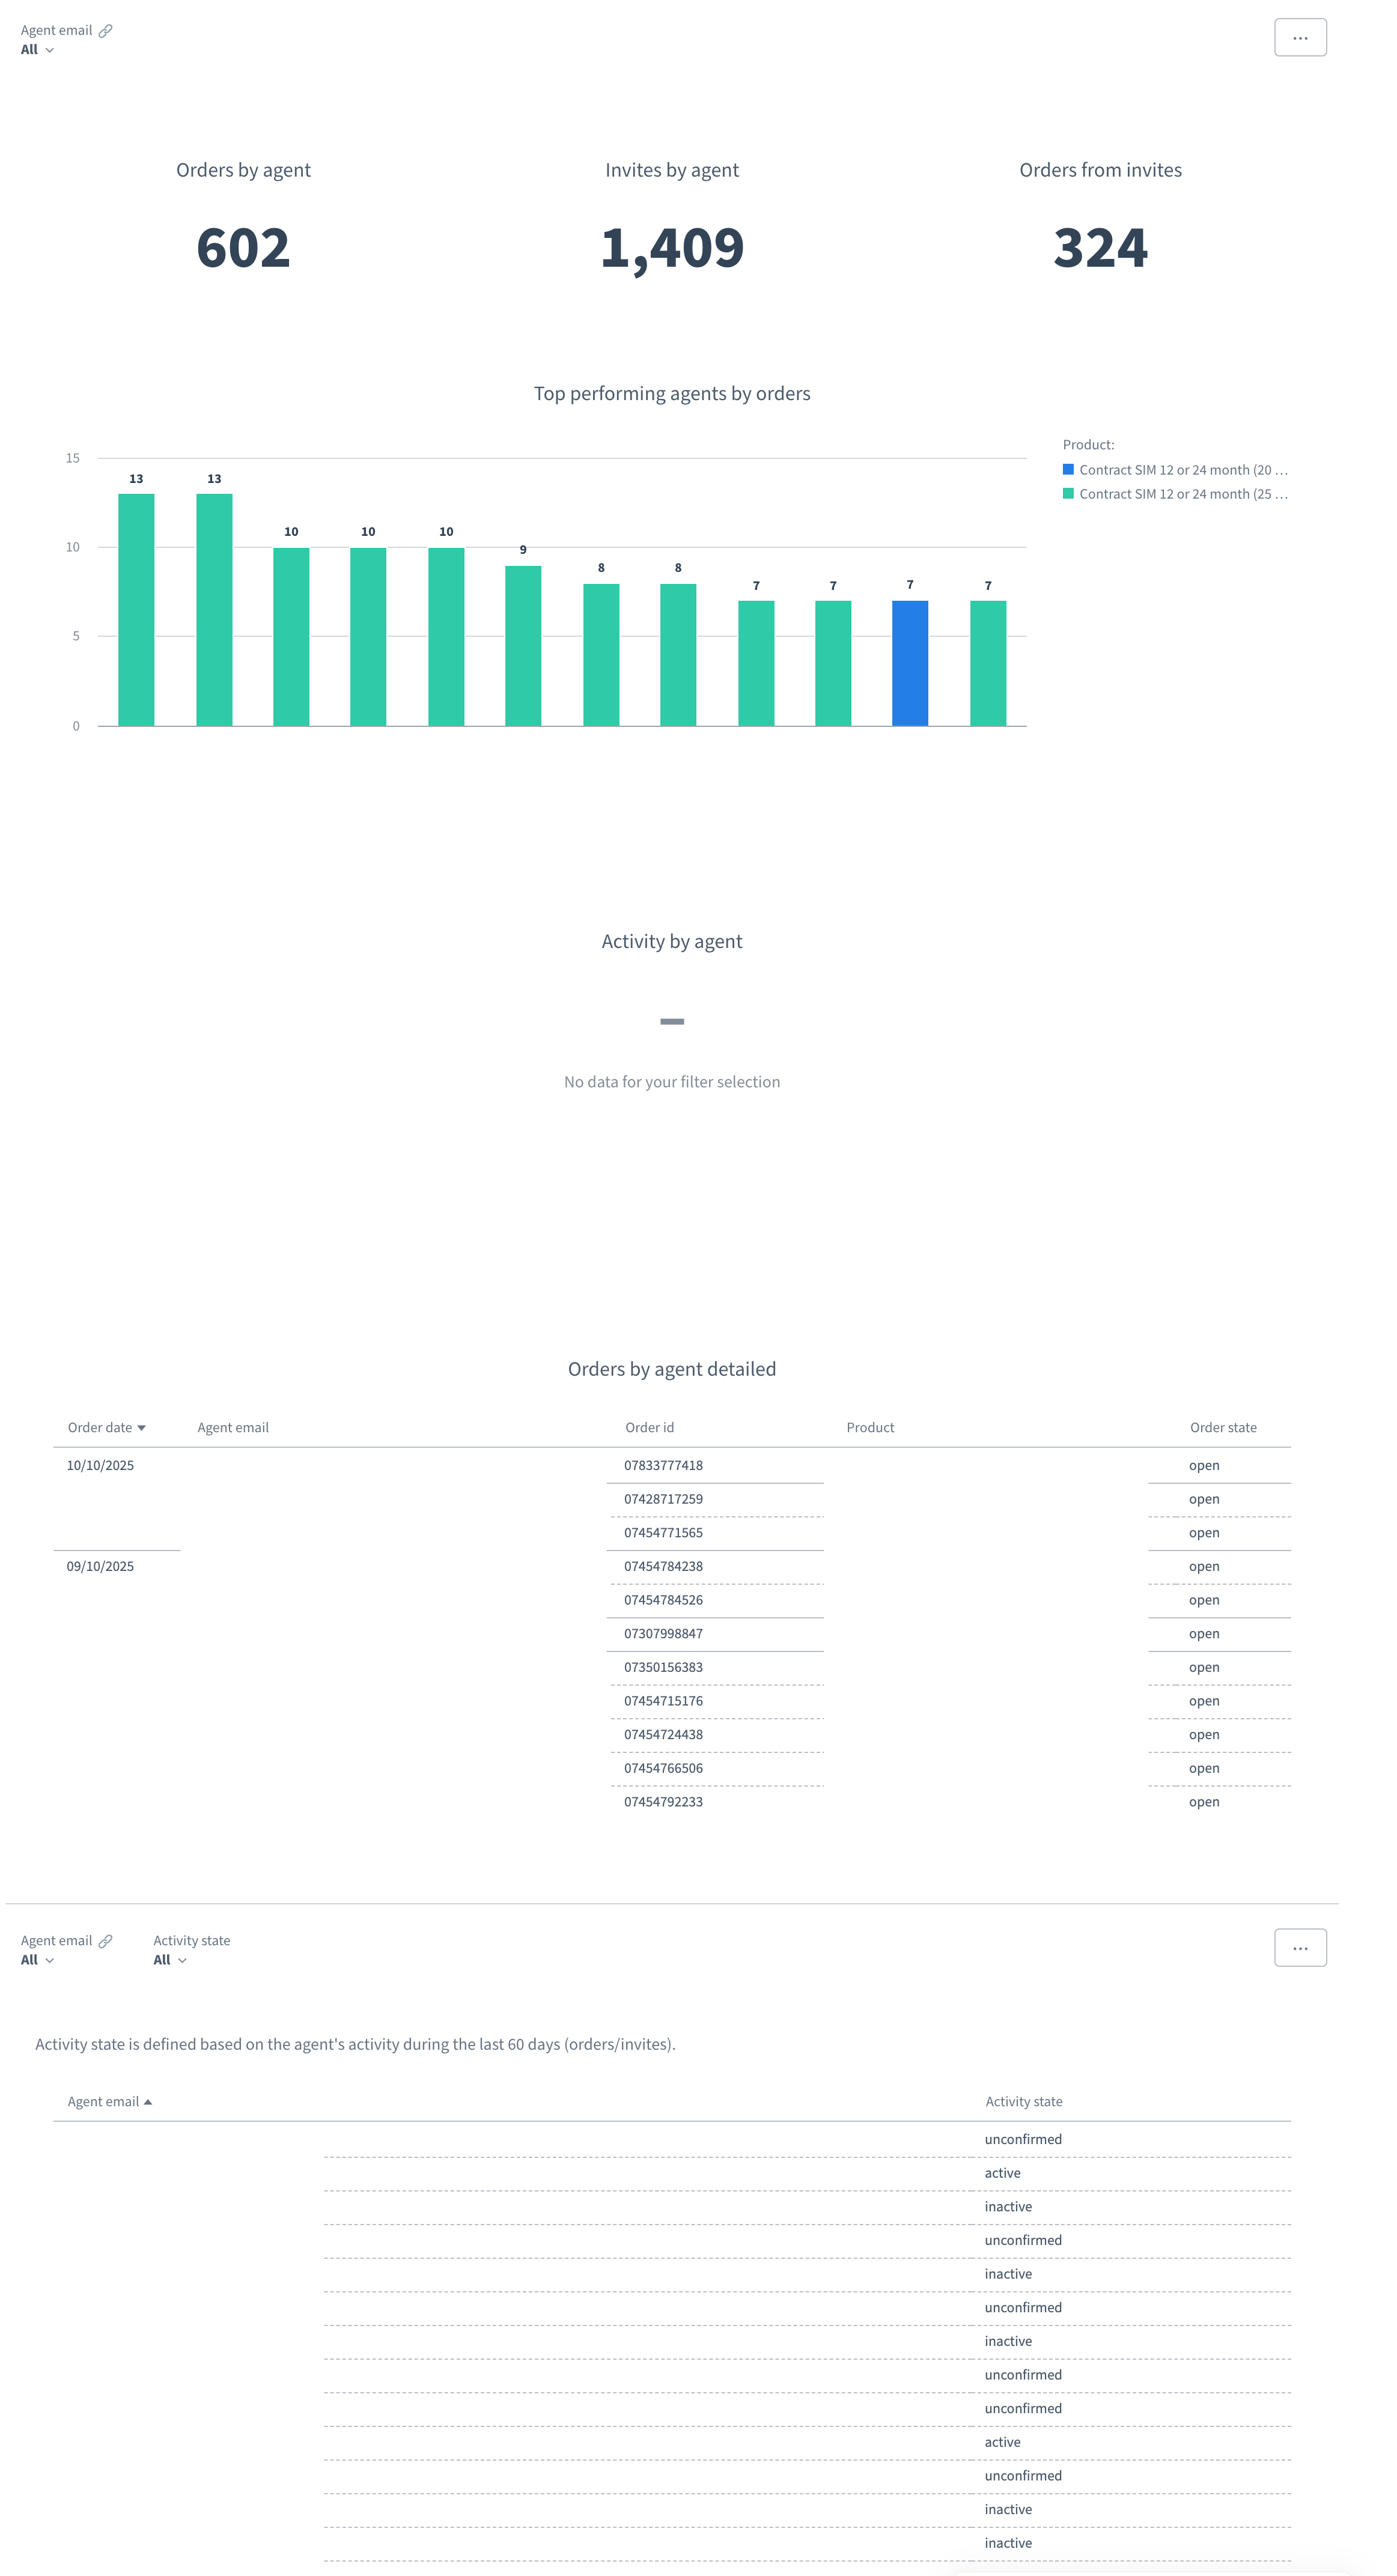
This dashboard is vital for programs involving internal sales or support agents, giving you insight into their activity and effectiveness.
- Total Orders by agent, Invites by agent, and Orders from invites.
- Top performing agents by orders.
- Orders by agent detailed and Activity by agent.
💡 Best Practices for Operations
- Proactively Address Bottlenecks: Regularly check the Confirmation Rate and Overdue Rewards on the Overview dashboard. If confirmation rates drop or overdue rewards increase, it indicates a validation process bottleneck that needs immediate attention to prevent user dissatisfaction.
- Optimize the User Journey: Use the Support Requests / Rewards (%) metric to pinpoint where users are getting confused or running into problems. A consistently high percentage suggests friction in your user experience or reward fulfillment messaging.