
Understanding Performance Insights
Aklamio’s ANALYZE section provides you with enhanced, granular views of your incentive programs. This level of detail helps you quickly identify key trends, pinpoint high-performing entry points, and make data-driven decisions to optimize program performance and boost sales.
Getting Started: Global Filters
Before diving into the specific dashboards, it's important to understand the global filters that apply across the entire Analyze section. Using these filters ensures seamless, quick analysis across different views (Performance, Funnel, and Operations).
- Navigate to the Analyze section in the main left-hand menu, and then select Performance.
- Apply Global Filters at the top of the screen:
- Programs: Select one or multiple programs to focus your analysis.
- Date Range: The default range is 28 days, which is set to smooth out typical weekly fluctuations for more reliable comparisons. Adjust this to any timeframe you need.
The Performance Dashboards
The Performance section is designed to give you a foundational overview of your programs' success through six specific, interconnected dashboards:
Performance Overview
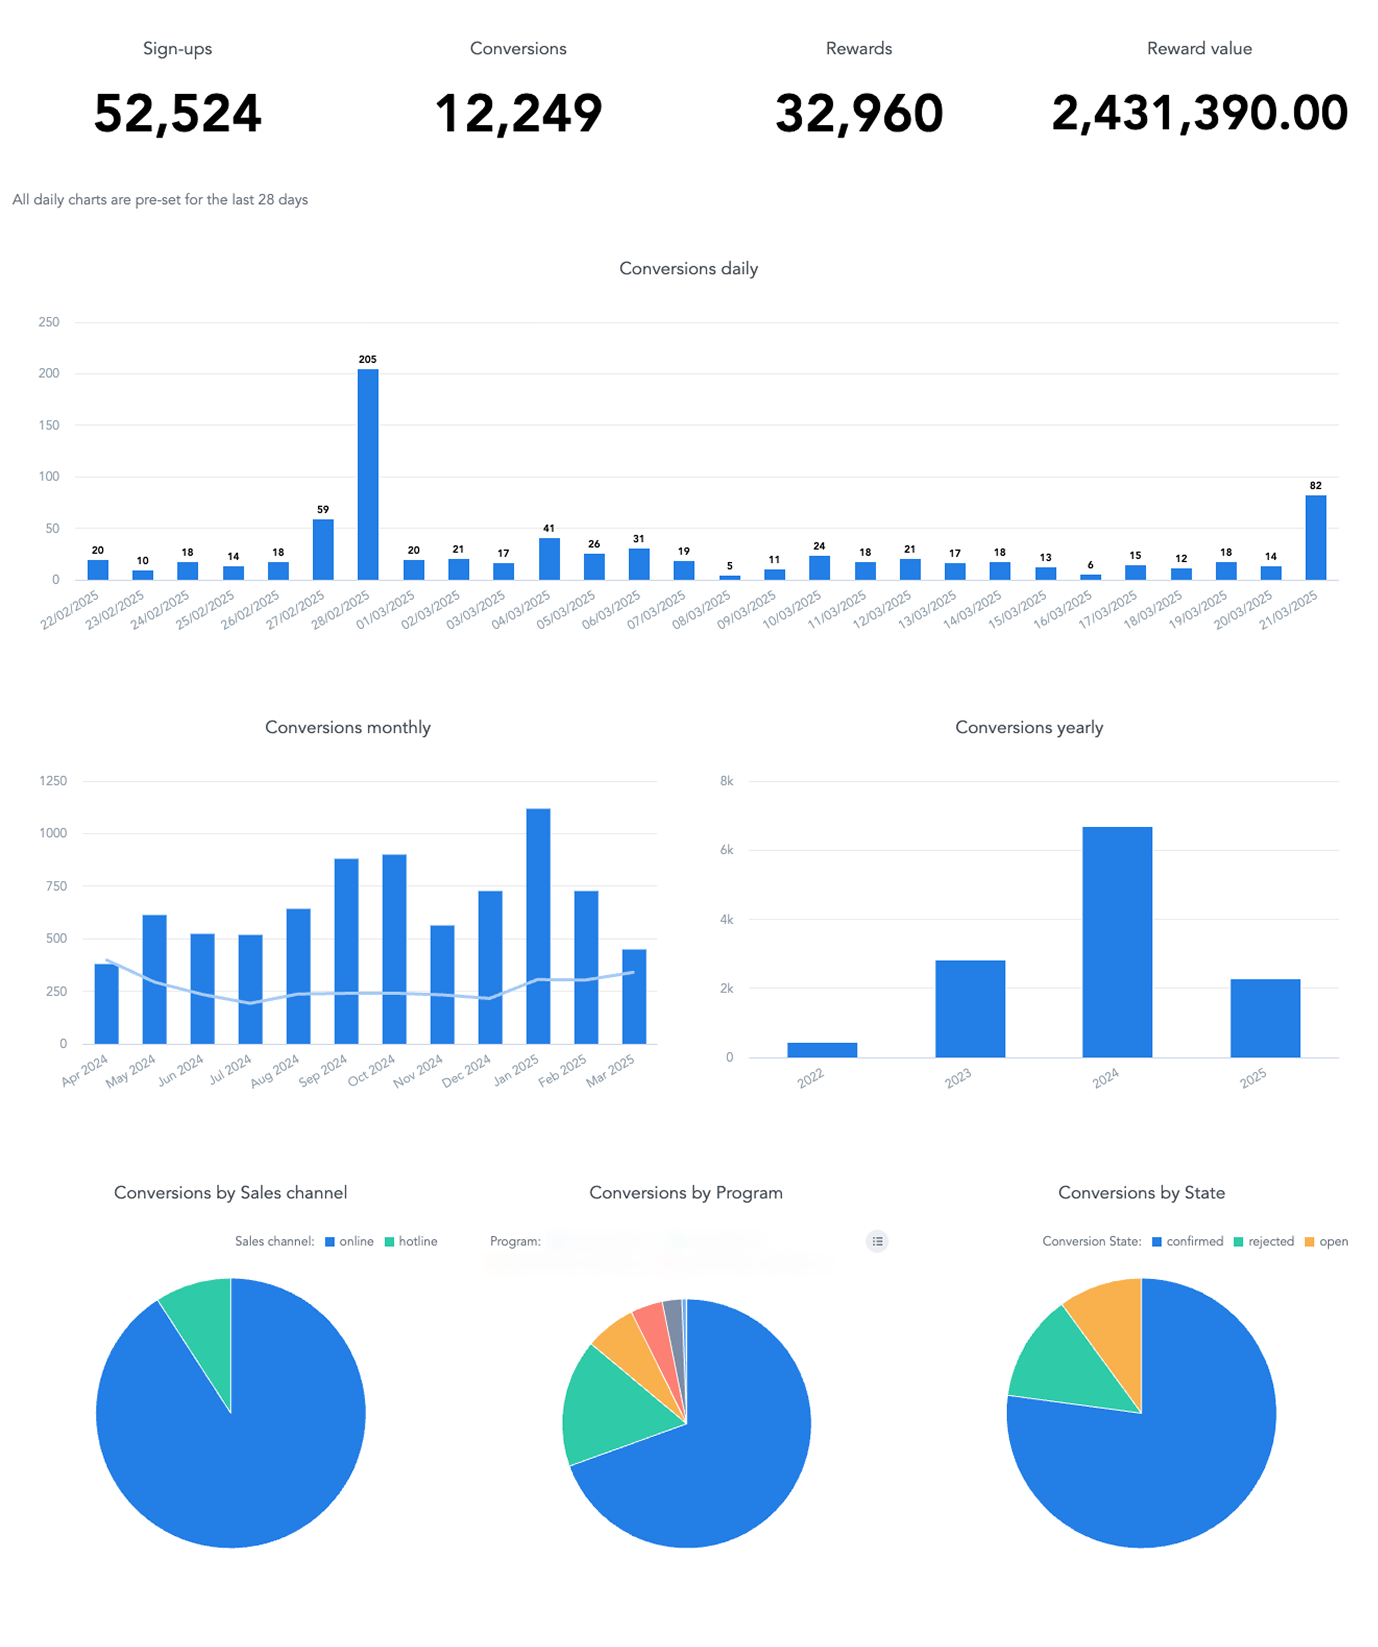
This dashboard gives you a high-level view of your core metrics across all selected programs:
- Sign-ups: The number of users who registered.
- Conversions: The number of single, rewardable actions users took (e.g., a completed purchase).
- Rewards: The total count of rewards distributed (as one conversion can lead to multiple rewards).
- Reward Value: The total monetary value of all rewards distributed.
Below the main metrics, you can find detailed breakdowns of Conversions by time (daily, monthly, yearly), Sales Channel, Program, and conversion State (confirmed, rejected, open).
Referral KPIs (Referral Programs Only)
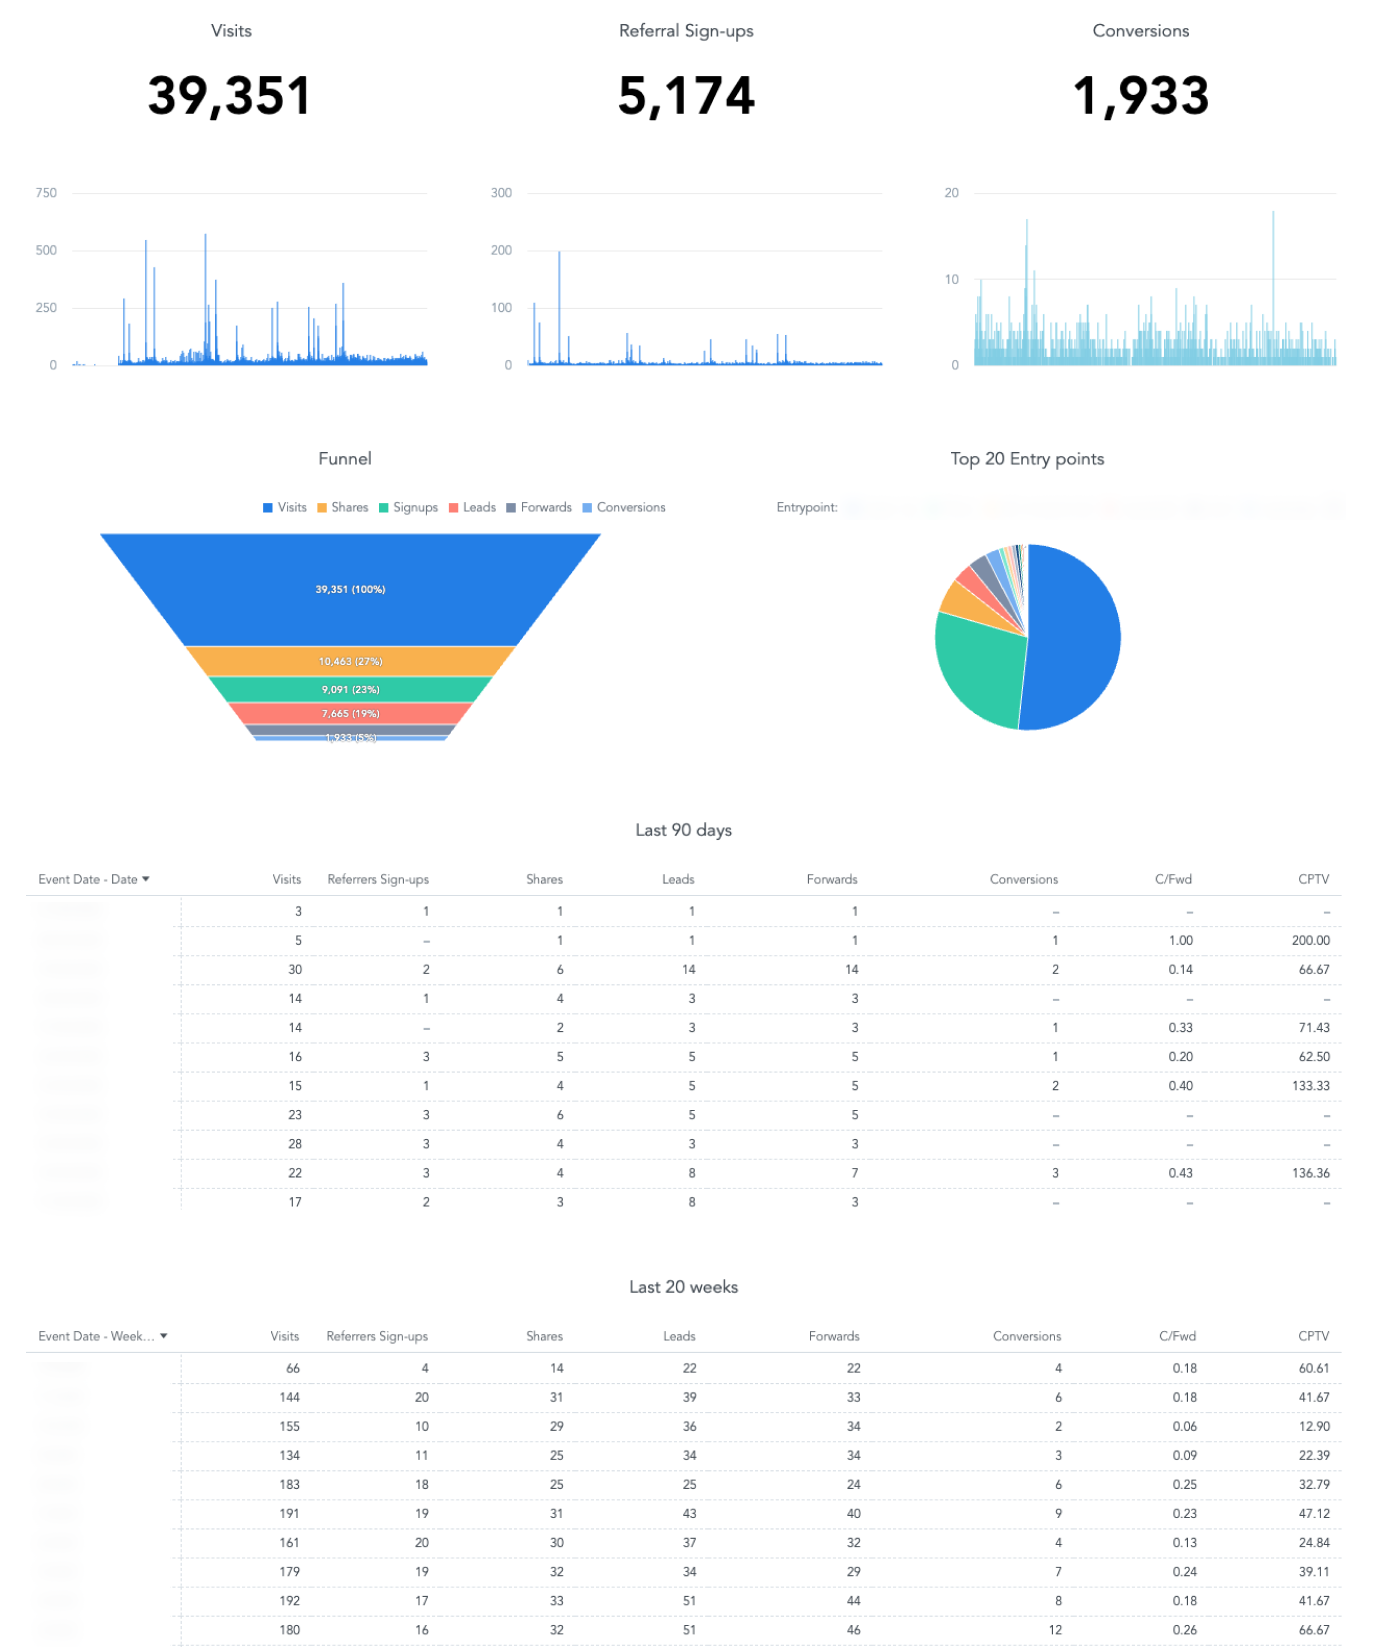
For your referral programs, this view details key metrics across the user journey, available for the last 90 days, 20 weeks, and 36 months:
- User Journey Metrics: Visits, Referrer Sign-ups, Shares, Leads (clicks), Forwards, and Conversions.
- Conversion Rates: Key ratios like the Conversion/Forward rate (how well users convert after being forwarded) and CPTV (Conversions Per Thousand Visits, measuring end-to-end efficiency).
Cashback KPIs (Cashback Programs Only)
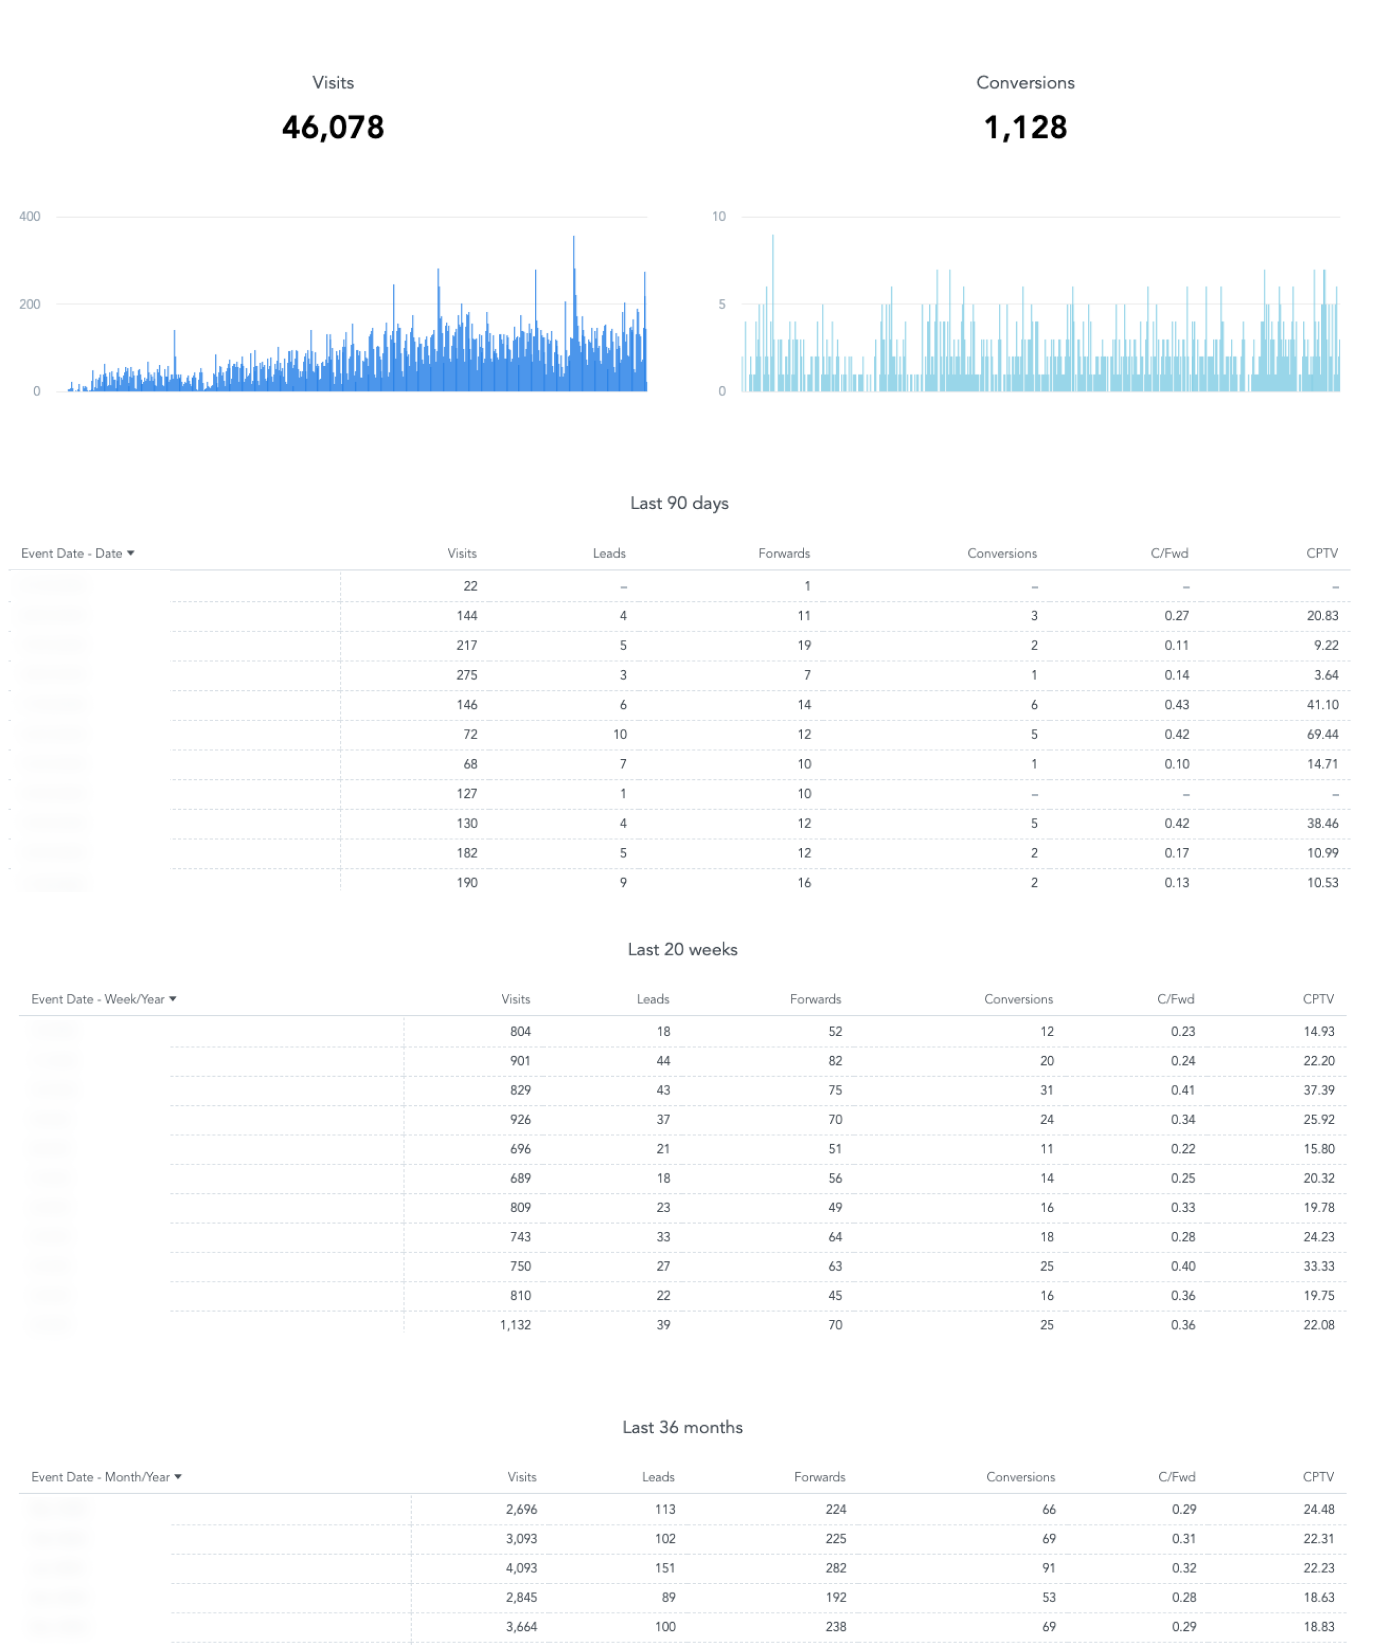
For your cashback programs, this dashboard focuses on the conversion path, available for the last 90 days, 20 weeks, and 36 months:
- User Journey Metrics: Visits, Leads (clicks), Forwards, and Conversions.
- Conversion Rates: Includes Conversion/Forward rate and CPTV.
Entrypoints
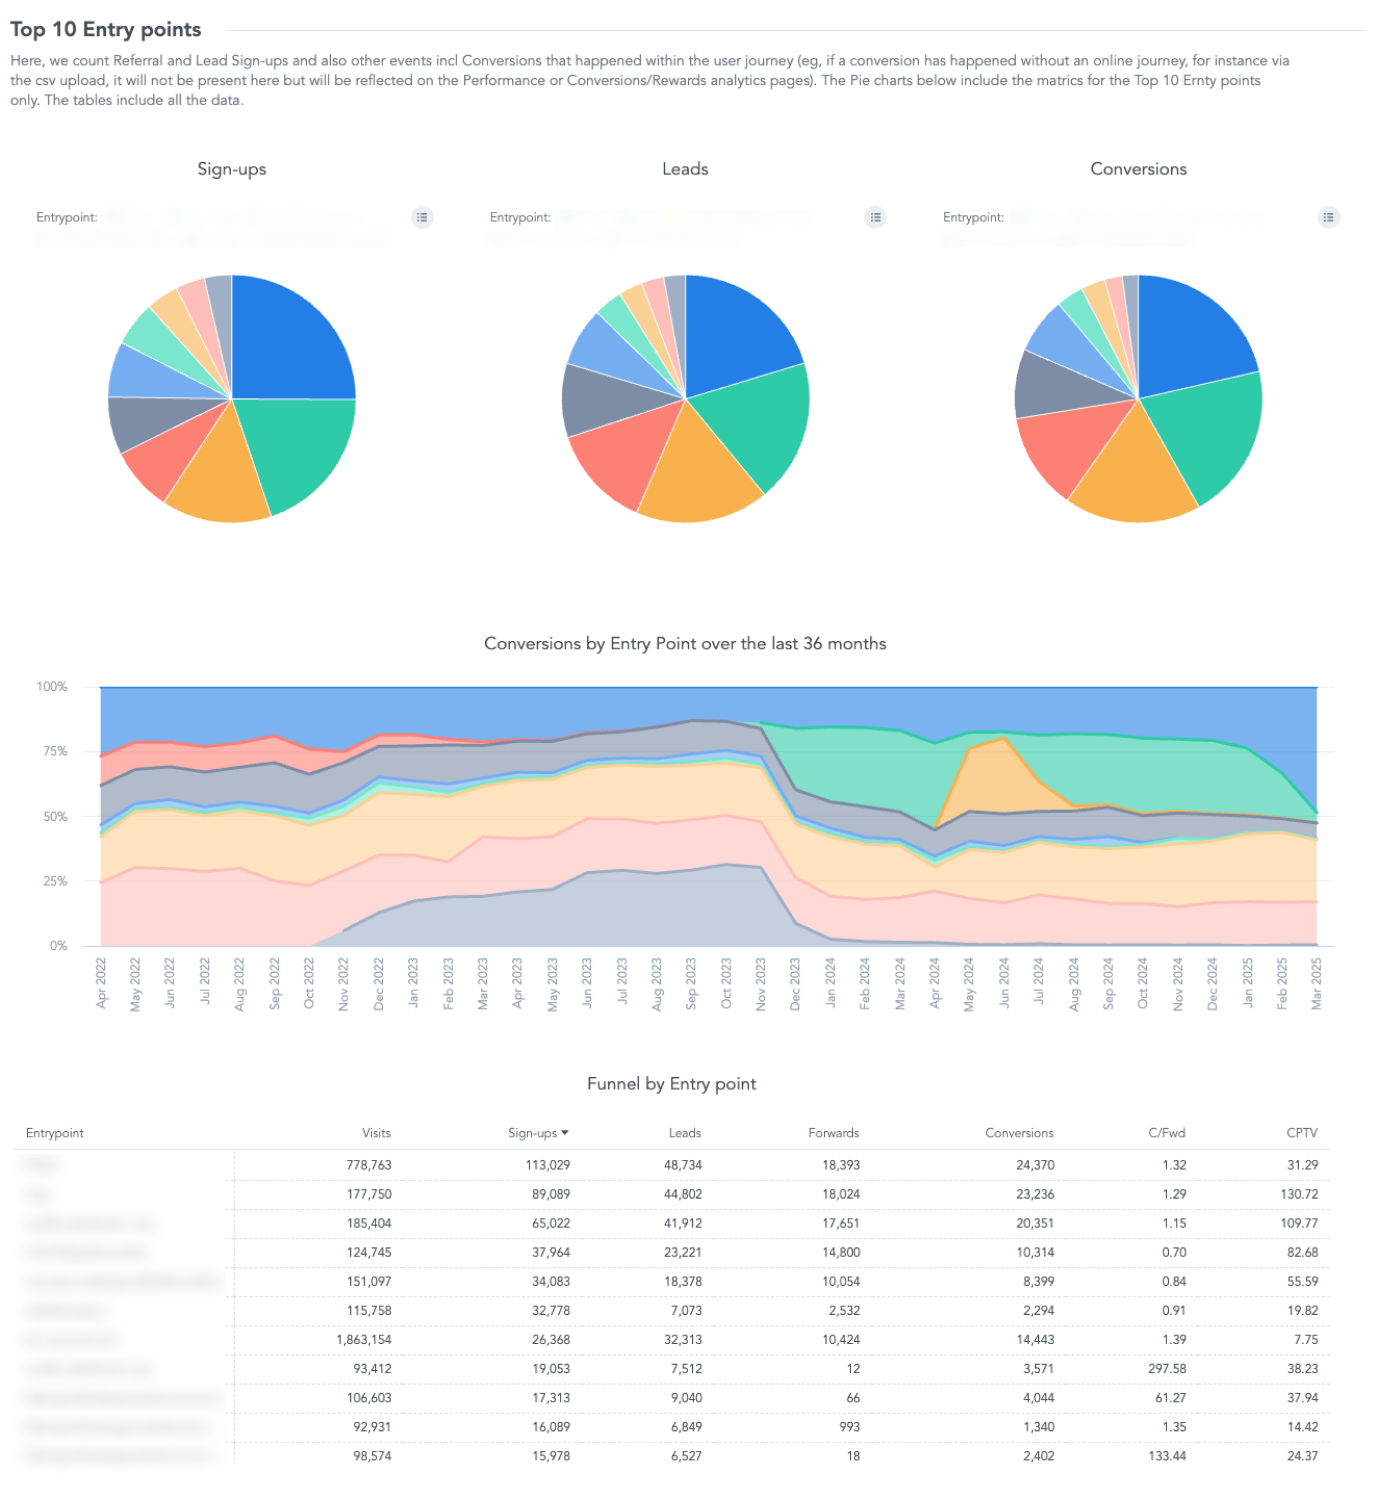
This specialized dashboard helps you understand the efficiency of your various starting points along the user journey:
- It provides a detailed breakdown of all entrypoints, including historical views over the last 36 months.
- Important Note: This dashboard only considers conversions that can be explicitly linked to an entrypoint (excluding conversions from sources like CSV uploads or support requests).
Conversions
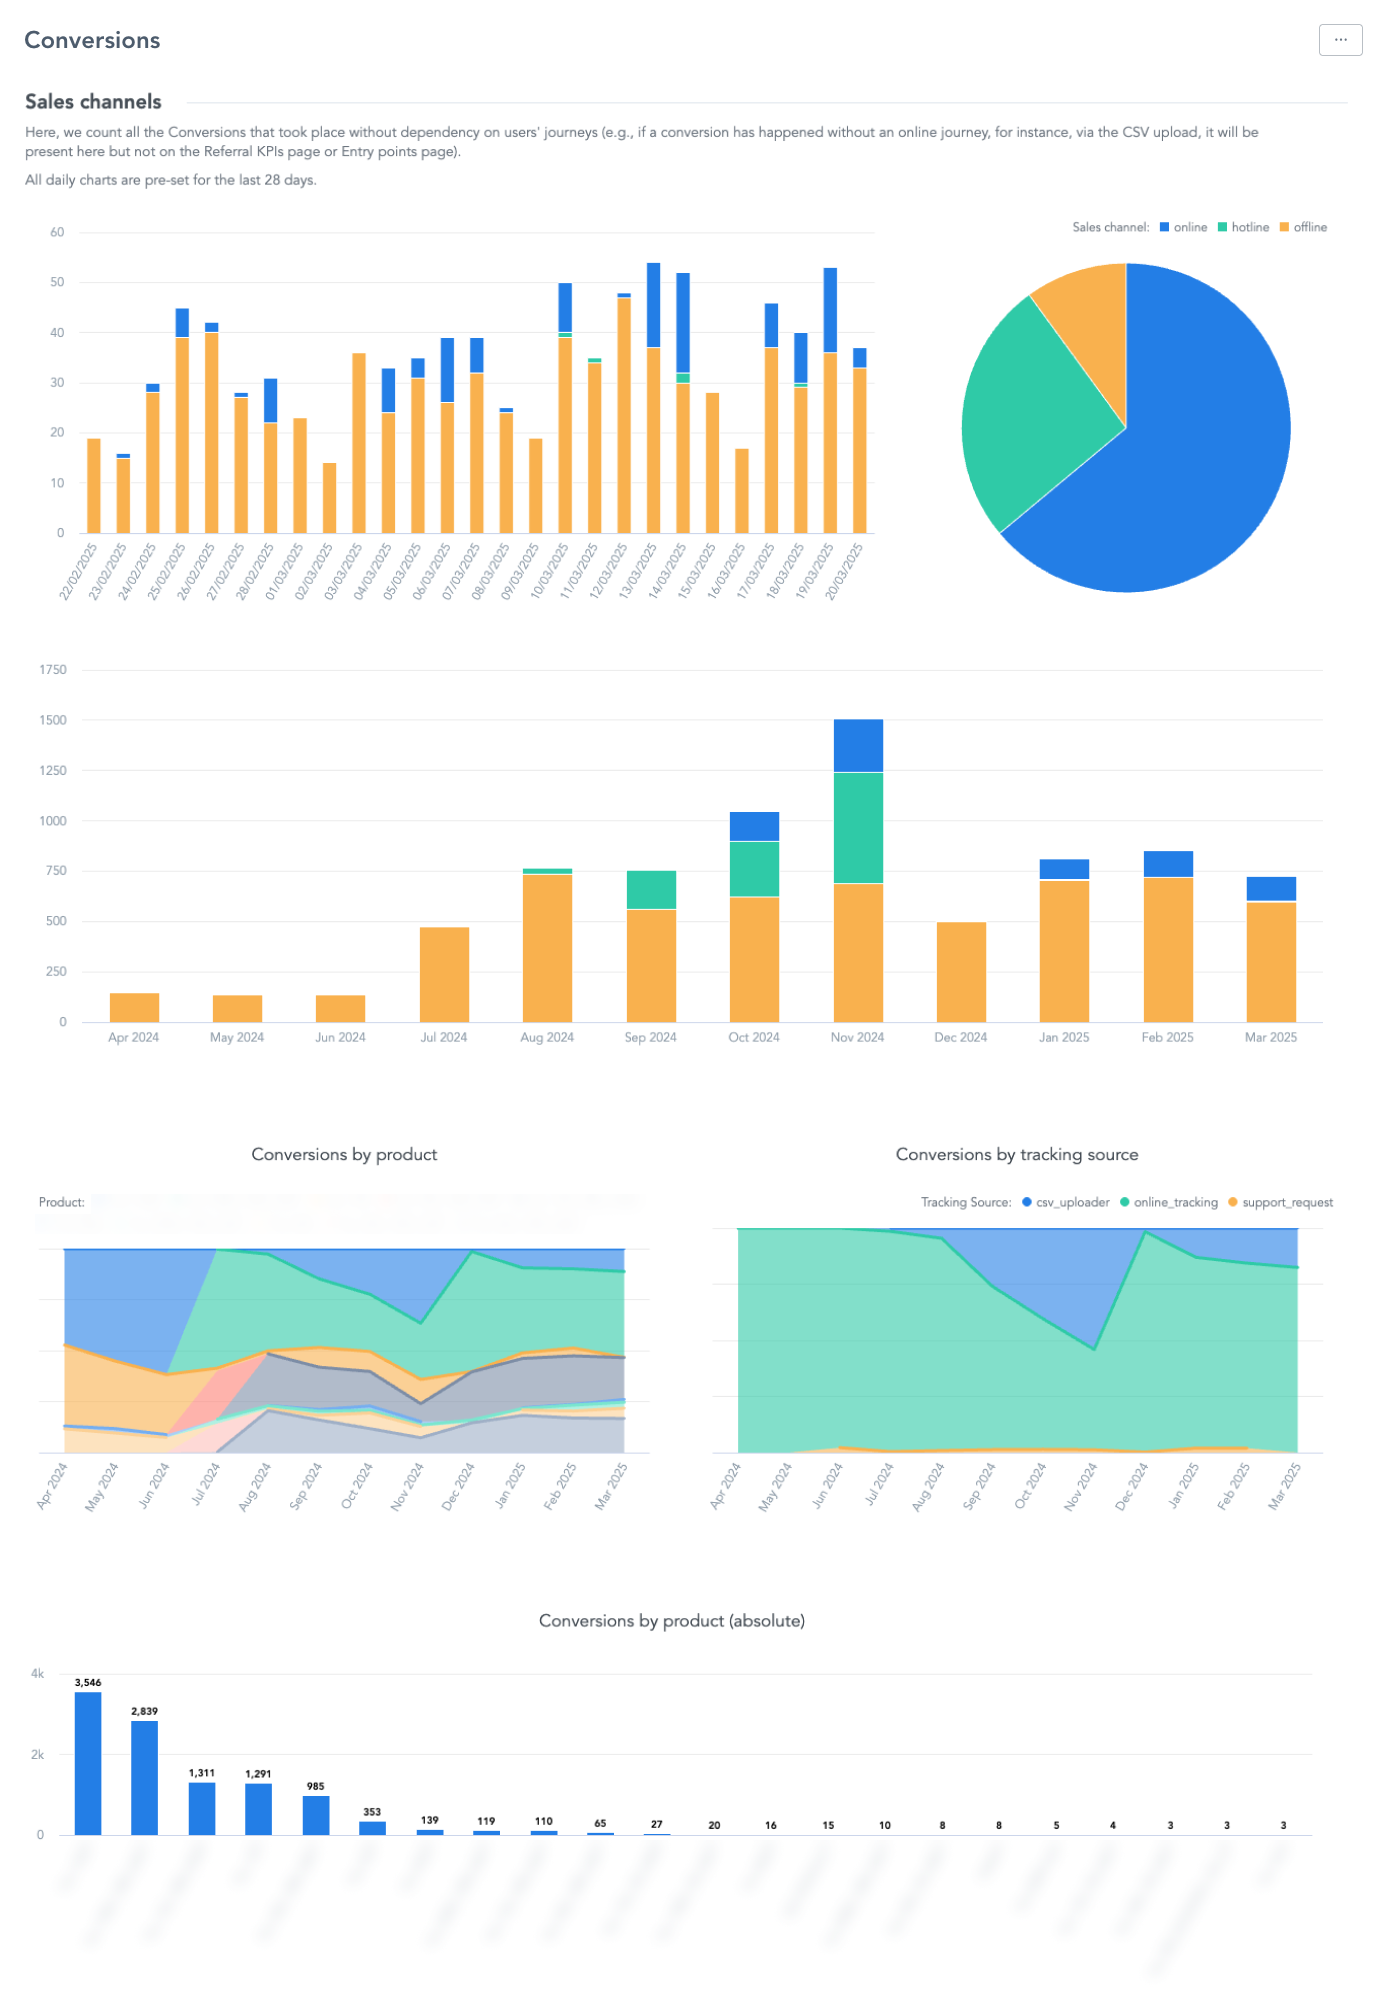
This view breaks down where your conversions are coming from, enabling focused optimization:
- Sales Channels: See performance across online, hotline, and offline channels.
- Product: Analyze conversion breakdown by product categories.
- Tracking Sources: Understand which sources track conversions (e.g., online tracking, CSV uploader, support request).
Rewards
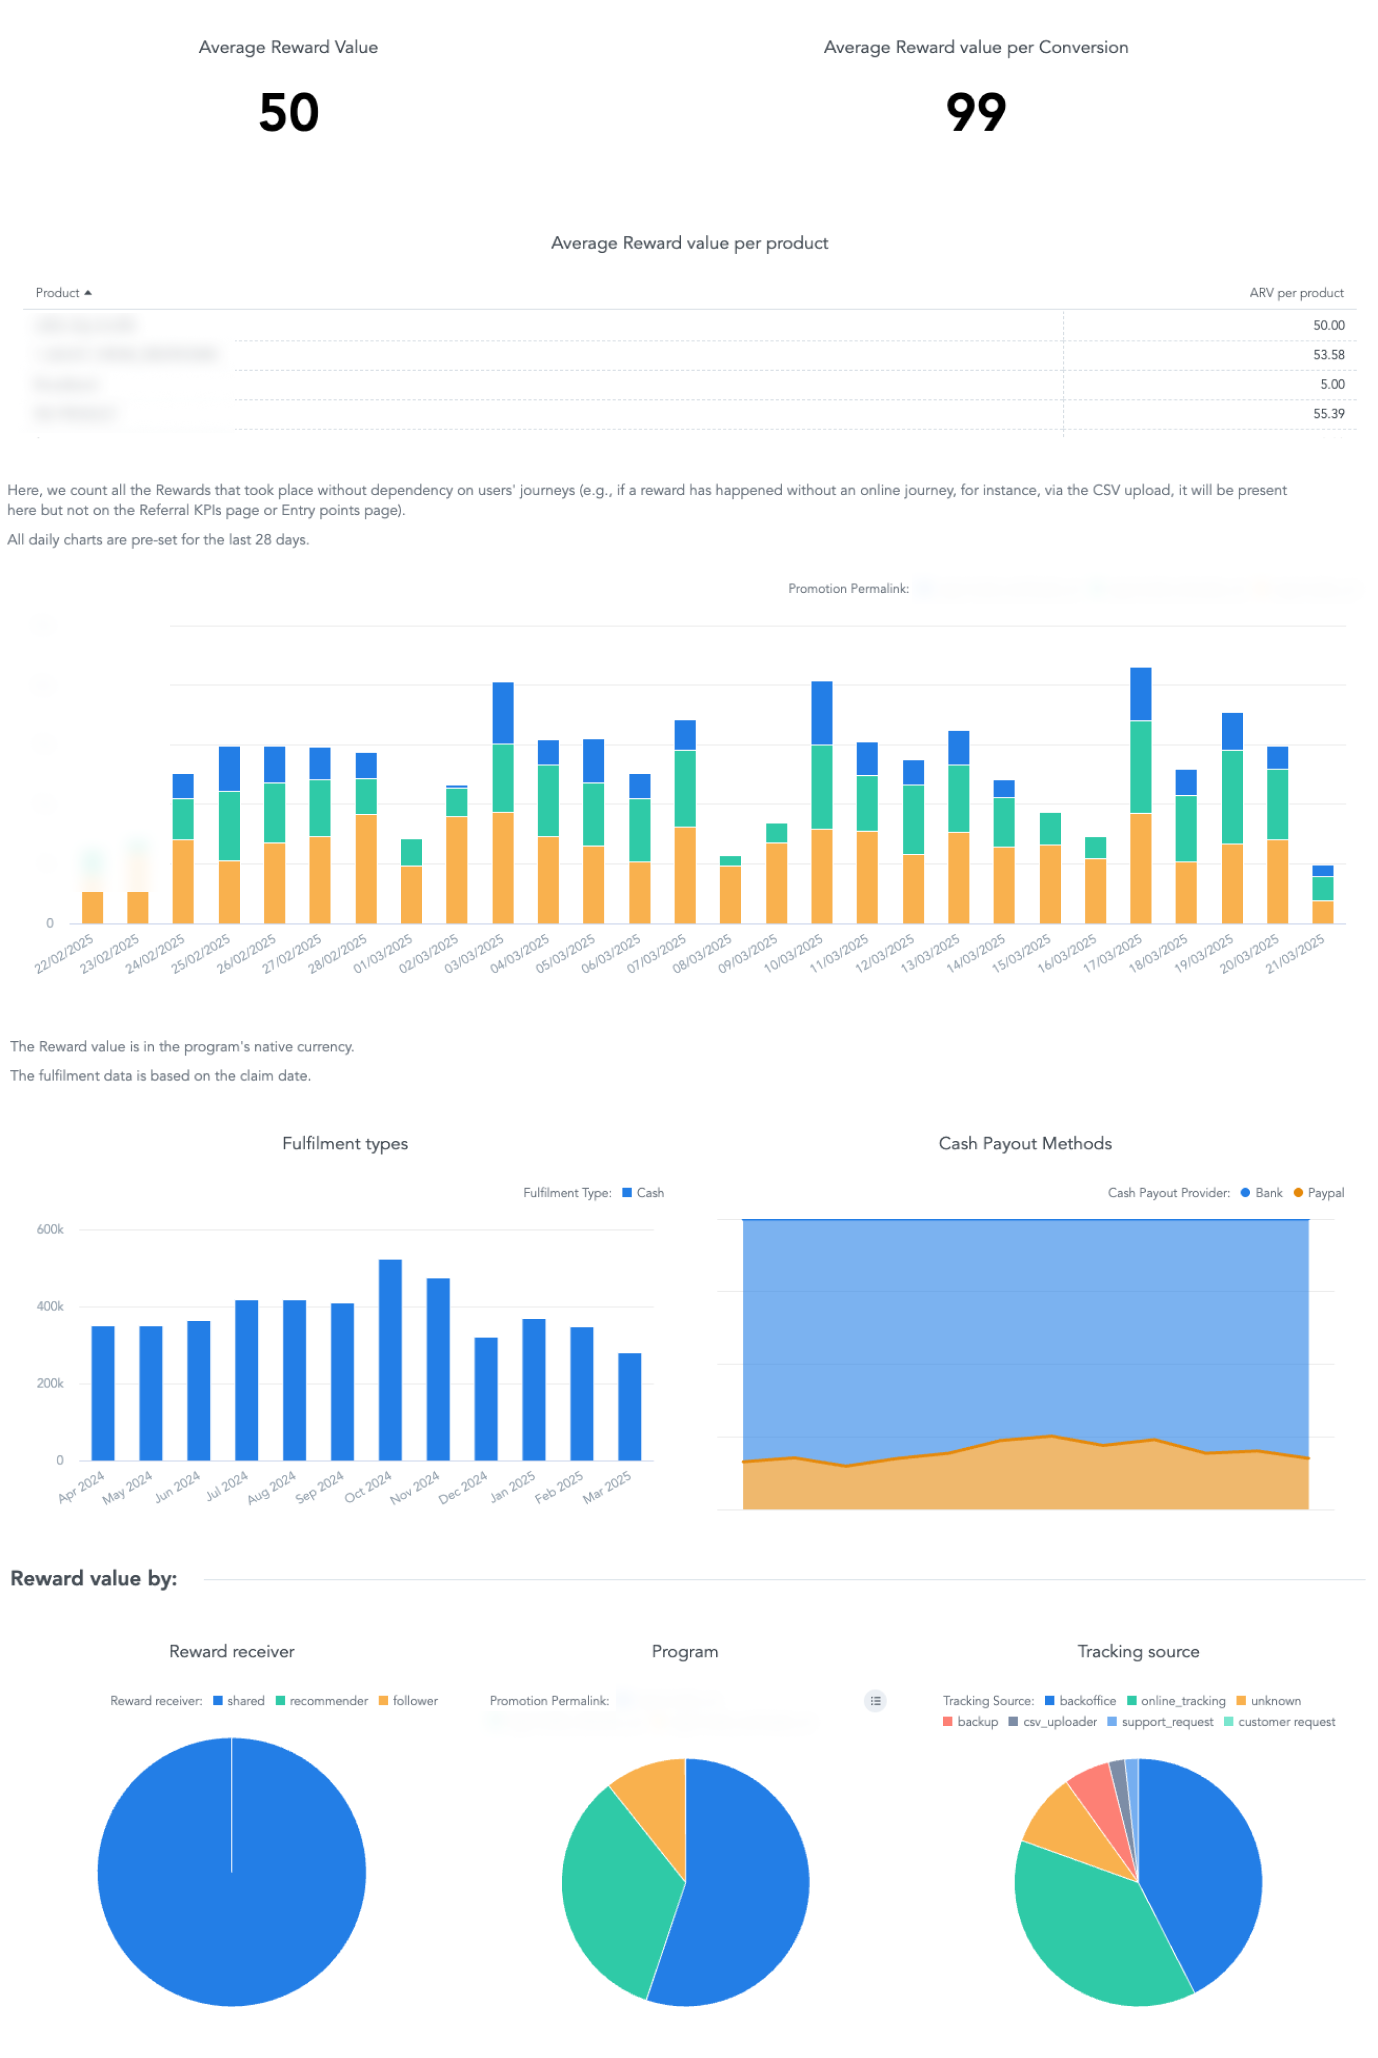
Use this dashboard to effectively optimize your incentive structure by analyzing the cost and fulfillment of rewards:
- Average Reward Values: See the average reward value overall and per conversion/product.
- Fulfillment: Analyze fulfillment types (e.g., Cash or Donations) and Cash Payout Methods (e.g., Bank, PayPal).
- Reward Value Breakdown: View total reward values split by Reward Receiver (recommender, follower), Program, and Tracking Source.
💡 Best Practices & Terminology
- Focus on the 28-Day Default: The new 28-day date range default is intentional. Use it for routine checks to maintain a consistent weekly cycle for comparison, helping you filter out noise from single weekends.
- Understanding Funnel Independence: The main performance metrics in the Performance Overview are now funnel-independent. This means they reflect the actual number of conversions and rewards that occurred on that day, regardless of when the user journey (visit) started.
- New Terminology: The platform now uses precise terms:
- Conversion replaces the old term "Rewards" for a single rewardable action.
- Rewards is now the term for the number and type of incentives given to users.
- Sign-ups replaces the older, ambiguous term "New users."
- Program is replacing "Promotion" across the platform.
🔧 Troubleshooting
Why do Conversion numbers differ between Dashboards?
Numbers between the Performance Overview and Entrypoints may differ because the Entrypoints dashboard deliberately excludes conversions that don't have an associated entrypoint (like conversions from CSV uploads or support requests). Always ensure you understand the specific filtering logic of the dashboard you are viewing.