
Analyzing your referral funnel
Introduction: Understanding the Referral Funnel
Aklamio's Funnel Insights provide an in-depth, predefined analysis of the entire Referral Funnel your customers experience. Unlike traditional funnel tools where you manually define every step, we have already mapped the core stages of your incentive program, allowing you to quickly spot where customers or leads are dropping off.
Identifying these drop-off points is crucial for optimizing your customer journey, reducing Customer Acquisition Costs (CAC), and maximizing the efficiency of your incentive programs.
The Two Referral Funnel Journeys
The Referral Funnel is split into two distinct, interconnected user journeys: the Referrer Journey and the Lead Journey.
| Funnel Journey | Step | Definition | Purpose |
| Referrer | Visits | Users that visited a landing page or first touch point. | Initial engagement with the program. |
| Referrer | Opens | Users opened the sharing experience (e.g., the sharing widget). | Intent to share/explore rewards. |
| Referrer | Sign ups | Users signed up with their email address (if required). | Commitment to participating. |
| Referrer | Shares | Users interacted with the sharing link (e.g., clicked "Share on WhatsApp"). | Successful promotion of the offer. |
| Lead | Clicks | User (lead/friend) clicked the link shared by the referrer. | Initial interest from the referred friend. |
| Lead | Lead | User interacted with the lead journey (e.g., chose a sales channel or started a form). | Intent to purchase/convert. |
| Lead | Forwards | User was forwarded to the forwarding URL (i.e., your shopping experience). | Final stage before conversion tracking. |
| Lead | Conversions | A conversion (e.g., purchase, sign-up) was successfully tracked. | The ultimate desired outcome. |
Navigating and Analyzing Funnel Insights
You can access and filter your Funnel Insights data to perform targeted analysis.
Accessing and Filtering
- Navigate to the Analyze section from your main dashboard.
- Click on Funnel in the sub-menu.
- Define the Time Window: Use the primary filter dropdown to select the reporting period (e.g., Days, Weeks, or Months) to review the funnel data over time.
Understanding Conversion Rates
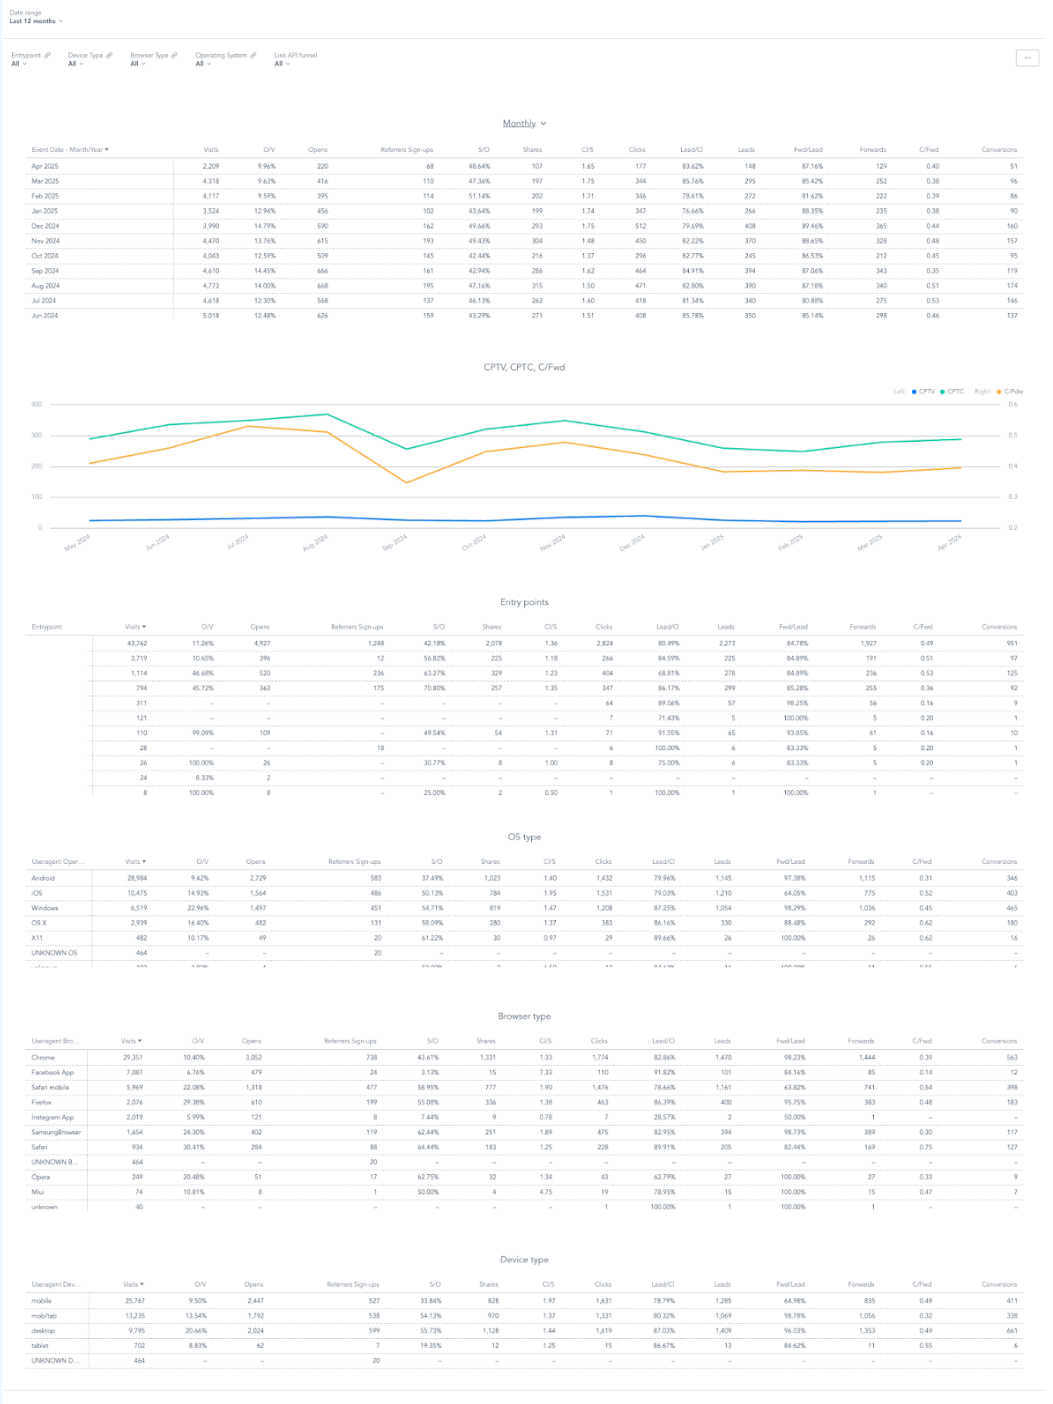
The dashboard features a trend graph displaying the three major, high-level conversion rates, which are essential for benchmarking performance:
- CPTV (Conversions Per Thousand Visits): Measures the end-to-end efficiency of the entire funnel, from the very first visit to the final conversion. It shows how many conversions you get for every 1,000 users who enter the program.
- CPTC (Conversions Per Thousand Clicks): Focuses on the efficiency of the Lead Journey, from the moment the friend clicks the link to the conversion.
- C/Fwd (Conversions per Forward): Measures the effectiveness of the final stage, the funnel within your shopping experience, from being forwarded to completing a conversion.
Using Breakdowns and Filters
To perform a deeper, cross-attribute analysis, the full funnel data is broken down by the following attributes, which can also be used as dynamic filters:
- Entry points: Analyze how performance differs based on the source or initial path a user took to reach the funnel.
- OS type: Compare conversion rates between operating systems (e.g., iOS vs. Android) to uncover mobile-specific issues.
- Browser type: Check for browser compatibility issues that may cause drop-offs.
- Device type: Determine performance differences across desktop, tablet, and mobile devices.
Use these breakdowns to ask specific questions, such as: "Does the Sign-up rate for users coming from the 'Email' entry point perform differently for iOS and Android users?"
💡 Best Practices for Funnel Analysis
- Focus on the Biggest Leak: Your highest priority for optimization should always be the stage with the largest proportional drop-off. If the drop from Opens to Sign ups is 50%, start there, as fixing it offers the highest potential uplift.
- Correlate Breakdown Data: If you see a severe drop in Forwards for a specific Browser type (e.g., Safari), that strongly suggests a technical or rendering issue specific to that browser that needs immediate attention.
🔧 Troubleshooting
A specific breakdown (e.g., a specific Entry point) shows a 0% conversion rate across the board.
Answer: This typically means the conversion event is not being properly tracked for traffic coming from that specific source, or there is an issue with the forwarding URL/tracking pixel integration for that path. Contact your Aklamio Customer Success Manager to verify the tracking setup.