
Understanding Your Partner Interface Dashboard
Introduction
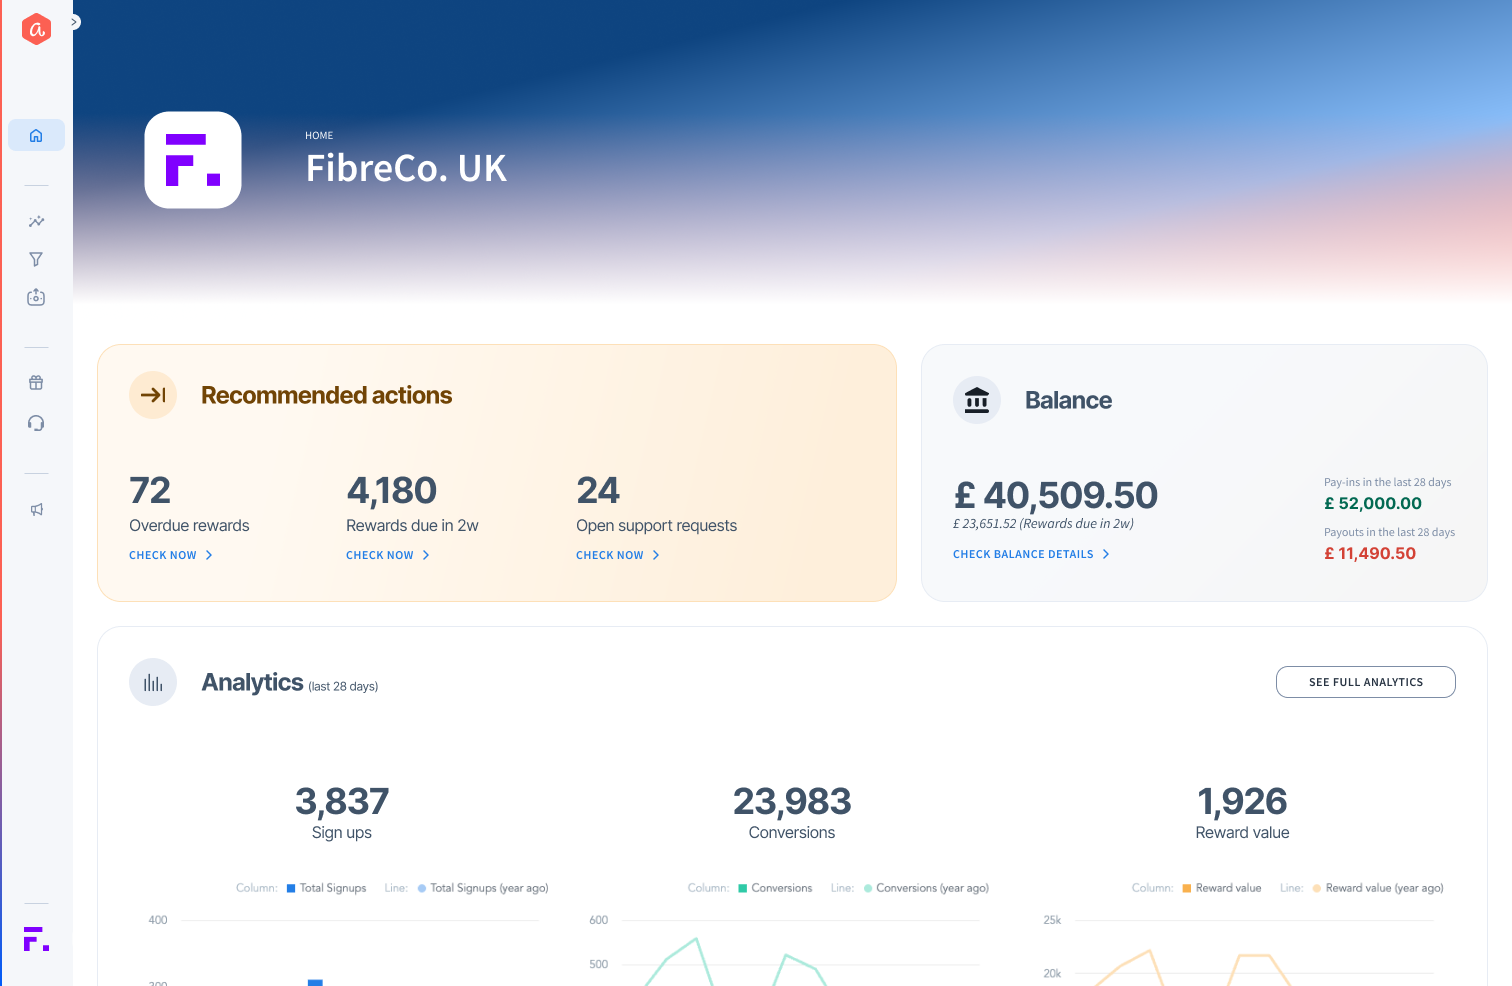
The Partner Interface (PIFC) Dashboard provides a centralized, actionable overview of your incentive programs. It is designed to give you immediate insights into performance trends and operational priorities, helping you manage your programs with greater efficiency and control. Upon logging in, the Dashboard is the first page you will see, presenting a holistic view of your program's health.
Understanding the Dashboard Widgets
The dashboard is composed of several widgets, each designed to provide specific information at a glance.
Recommended Actions
This widget proactively guides you to your most important operational tasks to ensure your programs run smoothly. It highlights three key areas:
- Overdue rewards: Rewards that have passed their payment due date and require your attention.
- Rewards due in 2w: A lookahead at rewards that will become due in the next two weeks.
- Open support requests: Customer support requests that are pending your review.
Clicking "Check now" under any of these items will take you directly to the corresponding page to take action.
Balance
The Balance widget offers immediate financial transparency by providing a clear overview of your account's funds.
- It displays your current total balance.
- It also shows amounts for payouts and pay-ins in the last 28 days and rewards due in the next 2 weeks.
You can navigate to a more detailed view of your financials by clicking "Check Balance Details".
Analytics
Get an at-a-glance view of your program's key performance indicators (KPIs) over the last 28 days. This widget helps you track recent trends for:
- Sign-ups: The total number of new participants in your program.
- Conversions: The total number of successful transactions or leads generated.
- Reward value: The total value of rewards generated from conversions.
For a deeper dive into your program's performance, click "See Full Analytics".
💡 Best Practices
Make it a habit to log in to your dashboard regularly. By promptly addressing items in the Recommended Actions widget, you can ensure a smooth reward experience for your customers and maintain the healthy performance of your programs.
🔧 Troubleshooting
What time period is covered in the Analytics widget?
The Analytics widget displays key performance data from the last 28 days to give you a current overview of your program's trends. For a more detailed analysis or to view different time ranges, click the 'See Full Analytics' link to navigate to the main Performance Insights section. “28 days” has been chosen to ensure that the natural weekly cycles of your sales do not give you a false trend, because a weekend was included or excluded by chance. 28 days gives you the exact same days across the last 4 weeks, thus a reliable indication of trends in your program.